In
this article we will how to monitor Azure Functions. In the article, we are
basically going to look into the GA’ing of the new portal experience for Azure
Functions. And specifically, you are going to dial into the monitoring aspects
of how to monitor a function, how to see what’s going on, even when you are not
in the portal.
Implementation:
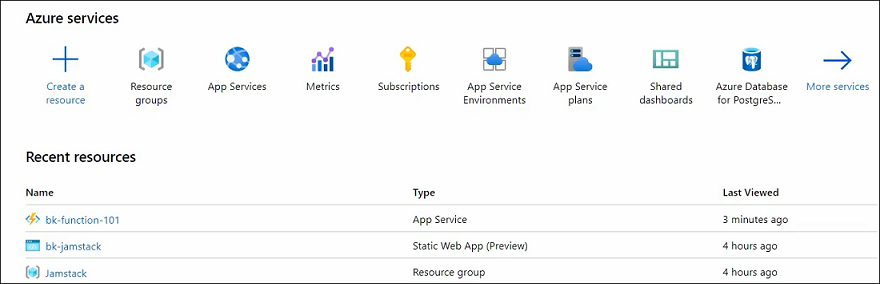
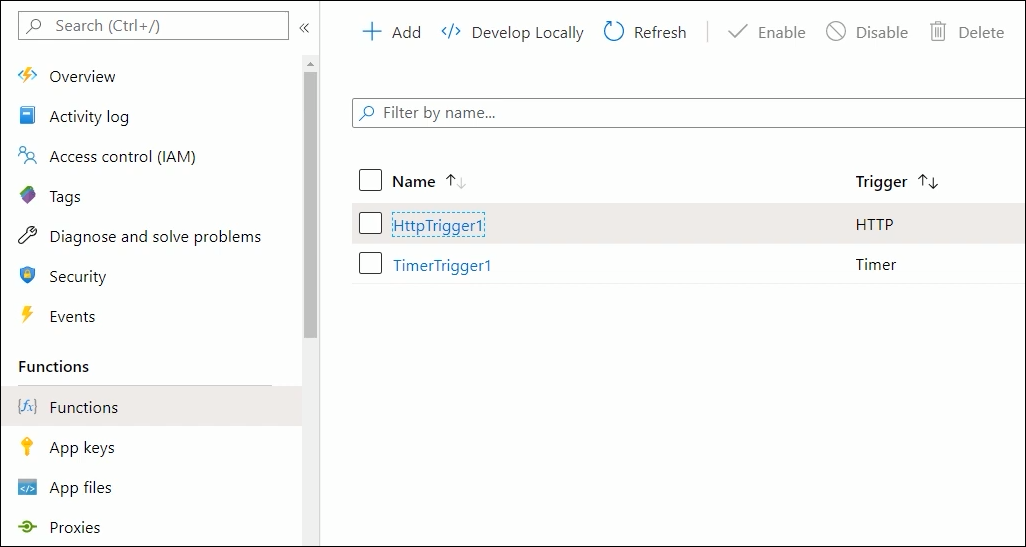
Let’s start by clicking on this function. And the first thing you are going to notice is that this is the new GA experience for managing functions in the Azure Portal. It’s a lot more consistent with the rest of the Azure Portal, including metrics in the overview blade. So, this is something that’s new for functions.
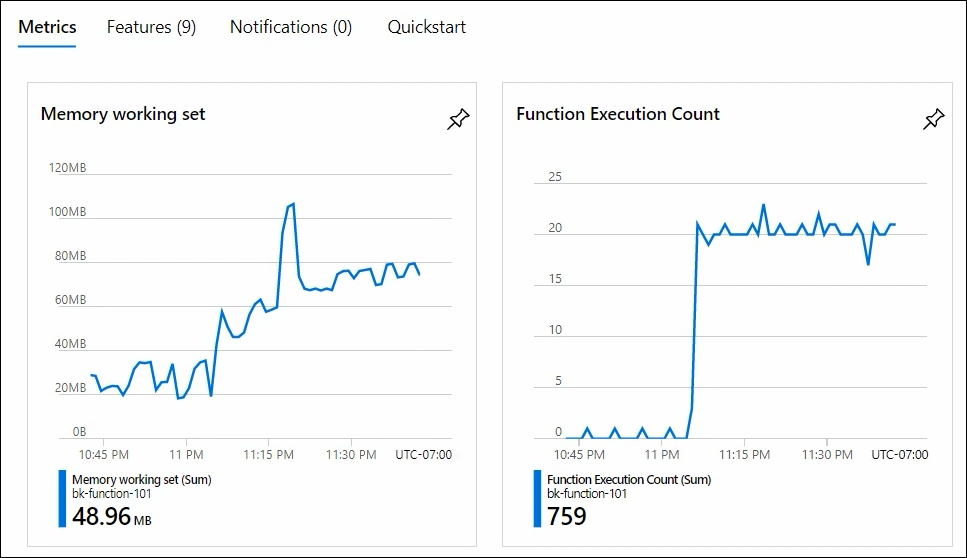
Azure has
the ability to show you metrics that are collecting all of the information for
all of the individual functions that exist within your function app. So in this
case, you have multiple functions deployed to this function app, so you can see
an aggregate of all the executions, an aggregate of the memory that is being
consumed by these individual functions.
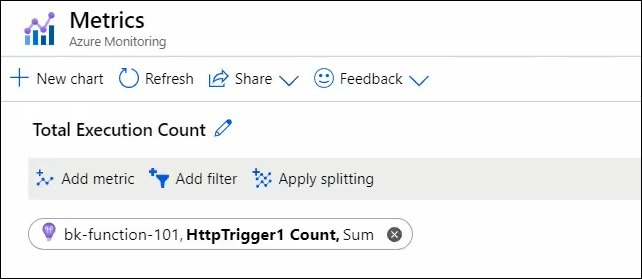
You can also
jump into the specific function that you want to look at, and you will get the
metrics that are in this case scoped to this specific function.
As with any other resource in Azure, you can now click directly into the monitoring view, where you can basically customize this query and query for any of the different metrics that are supported for an Azure Function.
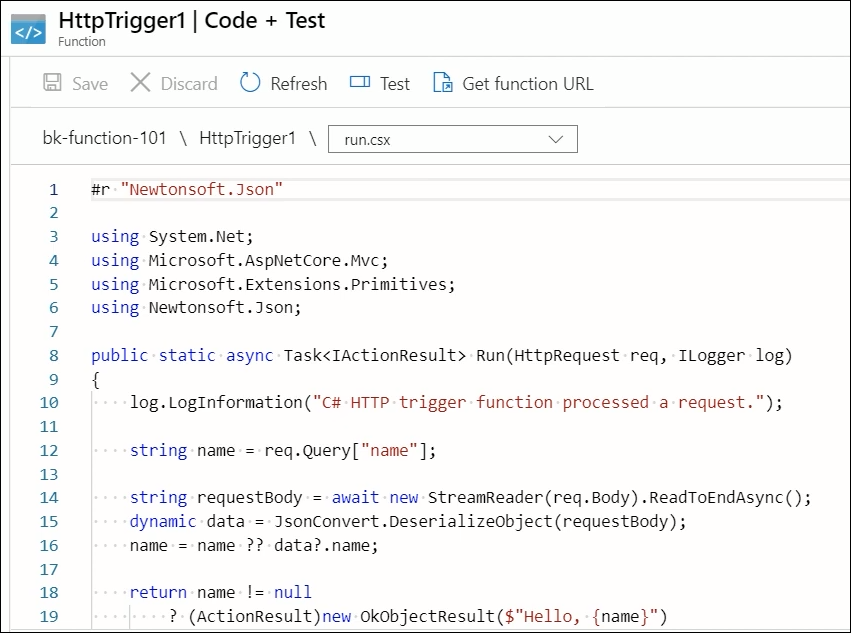
You can also
go over to the code editor. And one of the things that Azure is working on is
first giving you the ability to have more control over your real estate, so now
this basically conforms to the browser window. You don’t get a bunch of
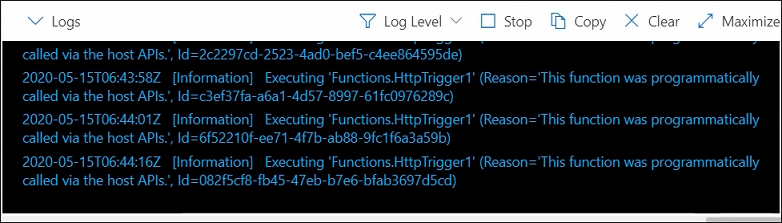
different scroll bars. And what you will see is that you can basically run this
and get logs directly here in the portal.
In the old
experience, Azure didn’t have the ability to provide this log streaming
functionality for all the different combinations of flavors for Azure
Functions. But now it does not matter if you are doing, for example, a Python
app running on a Linux host, hosted on a consumption plan or the serverless
model and doing local development where you are pushing the code from GitHub or
your Visual Studio Code instance running directly on your machine or if you are
doing in portal editing using C# and the Windows host and hosting it in a
premium function plan, this experience is going to be consistent and Azure has
this functionality across the board.
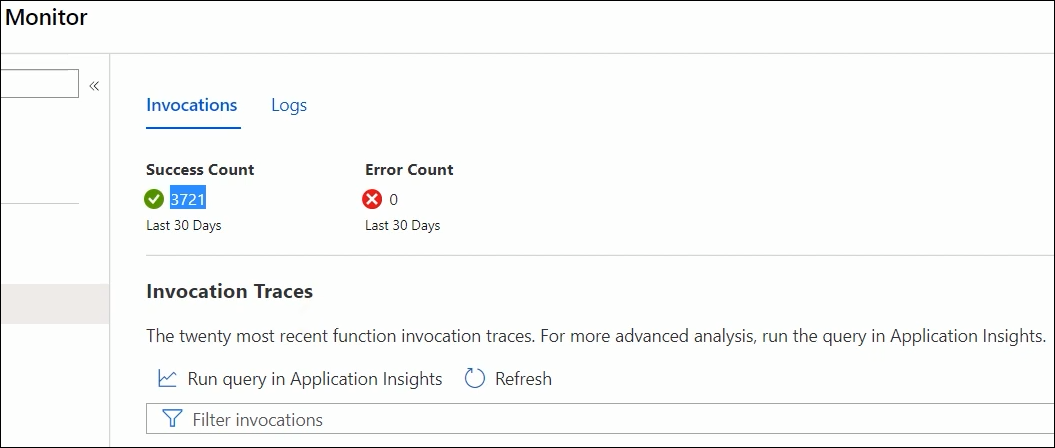
The next
thing is the monitoring view. This is really good to get a glance of what is
your executions over the last couple of days. You can filter here based on
status code or if you have a specific operation ID that you want to look for
specifically when you are doing debugging of a specific function, you can
filter it here.
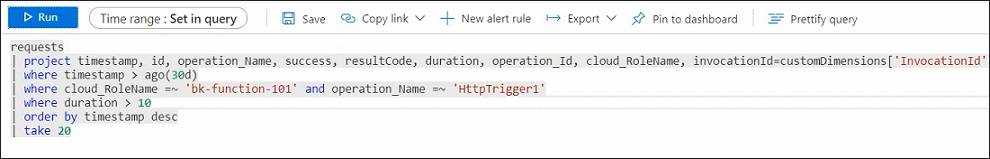
But you can
also jump all the way over into the Application Insights experience because it
has a much richer querying interface. So in this case, if you wanted to see any
function that took more than ten milliseconds to execute, you could adjust a
query. You can see that you have the IntelliSense built right in. So, said
durations greater than ten milliseconds. And here, all of these functions took
11, 12 milliseconds to execute.
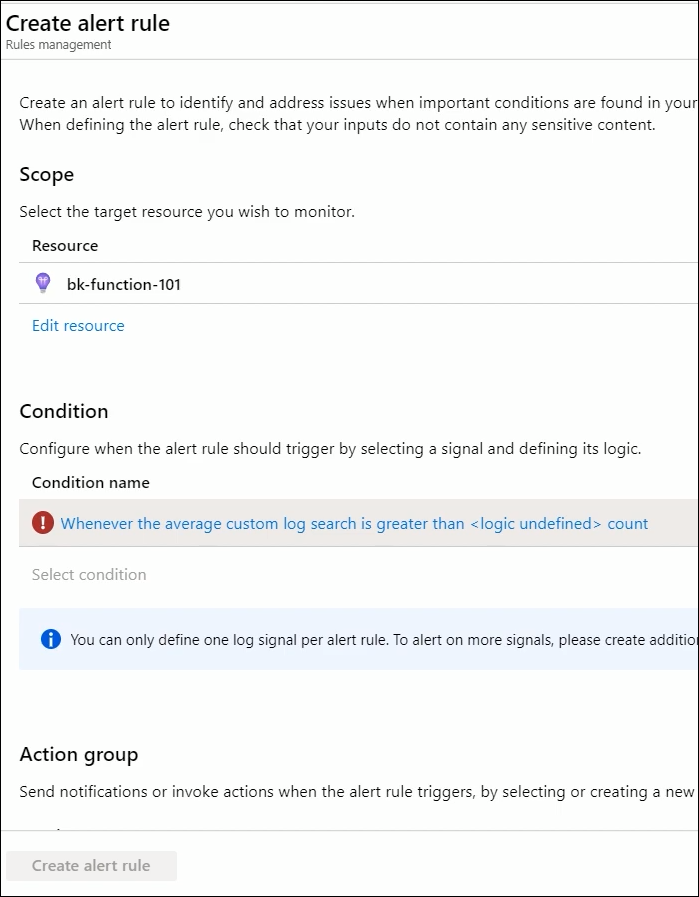
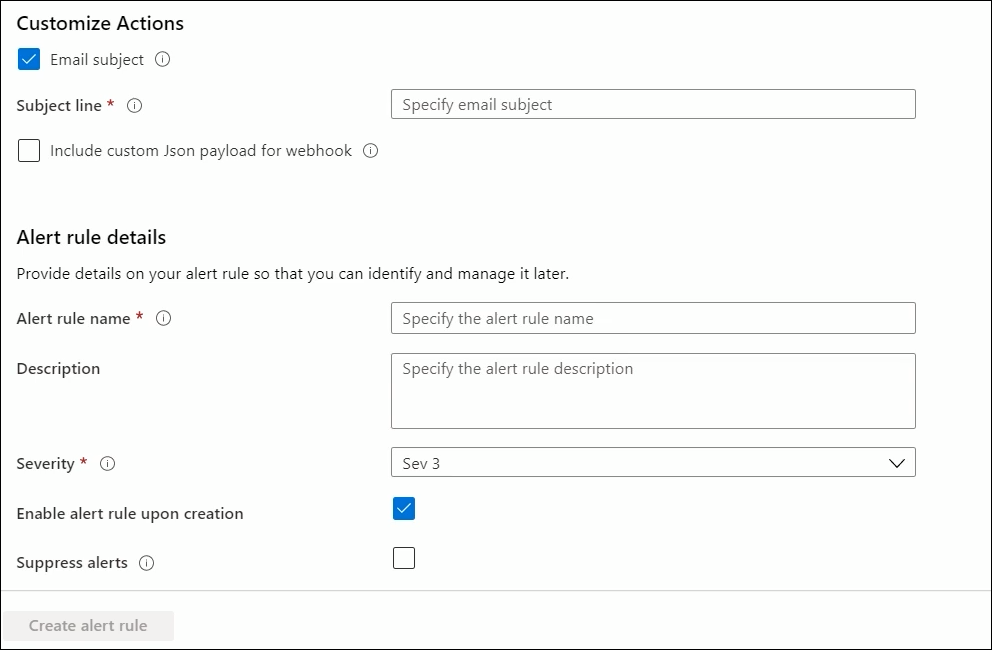
Now the
other thing that’s really powerful here is if this was a query that was
interesting to you that was basically giving you a signal for something that
you wanted to monitor even when you were not looking at the portal, You can get
here and create a new alert that will basically go and execute this query. You
can see the query right there where it’s looking at duration greater than ten
milliseconds. And what you can do is let’s say if there are over 100 function
executions that had over ten milliseconds of duration, and you want to do that
every ten minutes, basically, look at a 10-minute window every five minutes,
you can do that and it’s going to tell you what is your estimated cost for
running this query every month.
And then you
can choose to do something about it. For example, you can send an email or
trigger a webhook with a specific payload if you are using, for example, things
like pager duty or have other built-in monitoring or ticketing tools, you can
basically trigger a ticket directly from here.
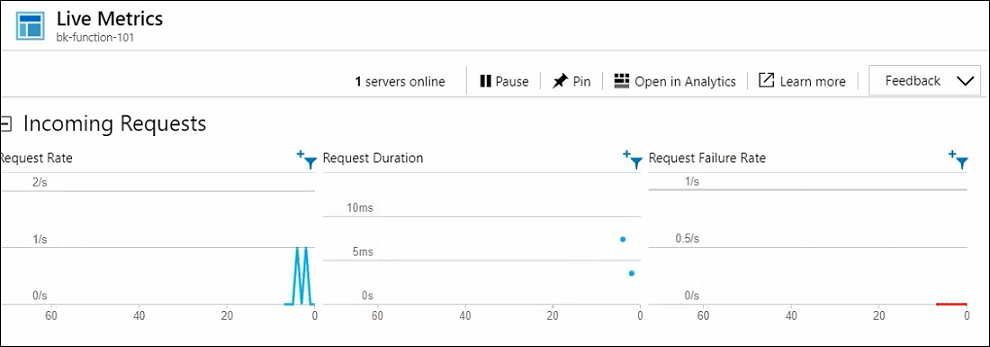
And then
finally, Azure also has a log tab where, again, this is basically the same
streaming log experience that was shown in the coding test. But you can also
from here jump directly into the live metrics view for Application Insights
that basically gives you those hot path metrics that are coming literally as
requested are coming in.
So with
that, you can see that Azure has a very new experience for Azure Functions in
the portal that is consistent with other Azure resources that leverage all of
the functionality that already exists and that you should already be familiar
with Azure Monitor. And it lets you view metrics and events that are happening
both at the function app level as well as the individual functions.
Hence, this
is how you can monitor your Azure Functions.


No comments:
Post a Comment