We are excited to release our tooling for continuous profile-guided optimization (PGO) for Go. You can now reduce the CPU usage of your Go services by up to 14 percent by adding the following one line before the go build step in your CI pipeline:
go run github.com/DataDog/datadog-pgo@latest 'service:<xxx> env:prod' ./cmd/<xxx>/default.pgoYou will also need to supply a DD_API_KEY and a DD_APP_KEY in your environment. Please check our documentation for more details on setting this up securely. In this post, we’ll walk through how Datadog PGO works and how we’ve used it in our own environment to reduce the CPU overhead of some key services.
How does it work?
datadog-pgo is a small command-line tool that downloads representative CPU profiles that are collected from your production environment by our Continuous Profiler. The tool then merges these profiles together into a default.pgo file, which it places in your main package. The go build command automatically recognizes the presence of this file and uses it to generate better machine code that is specific to your workload. In particular, it helps the Go compiler to make better decisions when it comes to the inlining and devirtualization of function calls. You can learn more about this feature in our documentation, as well as the official Go documentation.
One change worth $250,000
Before releasing this tool to our customers, we wanted to make sure the implementation was safe and lived up to its promise, so we decided to test it on a big internal Go service that is part of our metrics-intake system. This service auto-scales based on CPU utilization, making it an ideal candidate for this type of optimization.
The first challenge we faced was picking a profile. The official Go documentation recommends using representative production profiles, but does not specify a methodology for collecting them. So we decided to do a little experiment and picked three one-minute profiles from our fleet of instances that represent the maximum, median, and minimum CPU core usage we see in production.
Next, we used a benchmark that is representative of the main workload of our service to evaluate the effectiveness of each profile. To do this we first ran the benchmark as-is in order to establish a baseline, and then ran it again for each profile using the -pgo flag of the go test command. Here are the results:
| Profile | Unoptimized CPU cores | Delta |
|---|---|---|
| cpu-max.pprof | 11.8 | -5.4 percent |
| cpu-median.pprof | 6.1 | -4.4 percent |
| cpu-min.pprof | 0.2 | -2.0 percent |
As you can see, the CPU profile that captured the most CPU core activity produced the best results: a 5.4 percent reduction in CPU time compared to the baseline. This was done using Go version 1.21, and the results lined up with the 2–7 percent gains that were advertised for that release.
Next we renamed the cpu-max.pprof profile to default.pgo, checked it into the main package of our application, and deployed it to our staging environment. Our staging environment is very noisy, and so we were not able to clearly evaluate the performance impact. However, this step did allow us to confirm the safety of the PGO build itself, so we moved forward with slowly rolling out the build to production.
As mentioned above, the Go service that we used for testing our PGO tool auto-scales to respond to frequent changes in its workload. This made measuring the impact of PGO challenging as CPU usage of the service is highly variable in production. To address this, we decided to take the service’s total CPU time (containerd.cpu.total), divide it by the amount of points the service is processing (<xxx>.points_processed), and compare the result against a baseline from one week ago.
This produced the graph below. As you can see, after some turbulence created by the rollout, we were able to confirm a noticeable drop of about 3.4 percent in CPU usage.
We also confirmed a similar reduction in the number of replicas as the service downscaled in response to the reduction in CPU.
As mentioned earlier, this is a large service so even a meager 3.4 percent decrease in CPU usage translates into $250,000 in savings per year, which is a fantastic result from such a low-effort change. And it’s even more exciting when you consider that this service was already heavily optimized and is just one of many large Go services at Datadog that can benefit from PGO.
What about smaller services?
Of course, not everybody runs Go services as large as the one discussed above. However, we think that PGO can also benefit smaller services. Saving even a few percent of compute per host can lead to sizable cost savings that can, in many cases, make up for any cost overhead of running a profiler on that service. Even in cases where reduced CPU usage doesn’t directly lead to cost savings, you will still end up with better service latency, as well as more room to grow your business.
It’s also worth noting that PGO continues to improve. The experiment above was done with Go 1.21. For Go 1.22, the potential gains from optimization have been increased from 7 to 14 percent. As we’ve rolled this out to more internal services that use Go 1.22, we’ve already observed instances of over 10 percent CPU reduction. This rollout process to our own large-scale systems has also enabled us to identify and mitigate potential problems before they can affect our customers.
An unexpected problem fixed by one weird trick
PGO is still a relatively new addition to the Go toolchain, so we’ve been cautious in our approach to it. As much as we want to impress you with flashy success stories, we care even more about ensuring the safety and positive impact of the things we offer. The experiment above was just the beginning of our due diligence for PGO. Further testing revealed some unexpected results that have helped us both improve the datadog-pgo tool and identify opportunities to help improve Go’s optimization
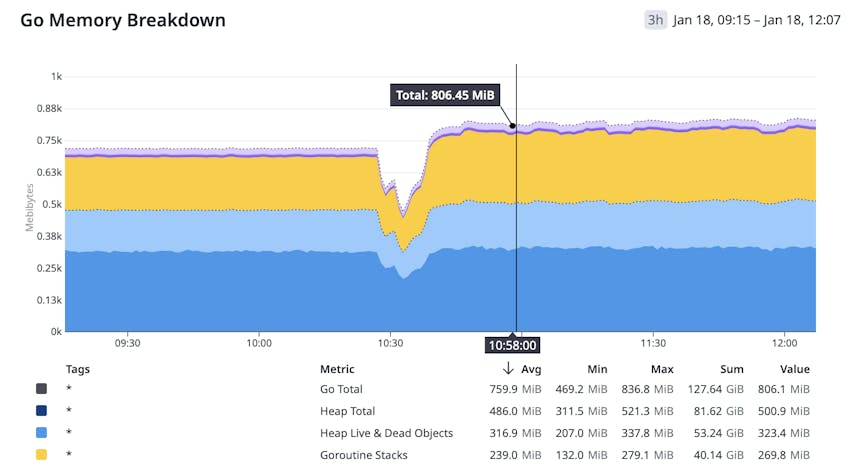
While working with other internal teams to test PGO against their services, one team made an interesting discovery: one of their services experienced a 10 percent increase in memory usage after deploying PGO.
As we dug into the problem by looking at Go memory metrics, we realized that the increase was primarily coming from goroutine stacks. Unfortunately, there is currently no profiler to analyze goroutine stack size, so we did what we do best and built an experimental profiler to find the root cause of the issue. We traced it down to an unfortunate inlining decision in the gRPC library we use. The problem was caused by a function that was allocating a 16 KiB array on the stack, and PGO was causing this function to get inlined three times into the same caller frame. You can read about it in great detail in the upstream issue we filed.
We believe that issues like this will be rare in practice. Datadog uses gRPC at a very high scale, and in our case the problem was greatly amplified by our services keeping an unusually large number of gRPC connections alive. So unless you’re running a similar gRPC setup, you should not experience this problem. Additionally, until the upstream issue is resolved, we have implemented a temporary mitigation in our datadog-pgo tool so that this issue won’t affect our customers. It works by modifying the downloaded CPU profiles to ensure the problematic function won’t get inlined. We’ll keep updating our tool in case similar issues are discovered in the meantime.
Finally, we’ve submitted an upstream proposal and prototype to contribute a new goroutine stack profiler to the Go project, which could help with debugging similar issues in the future.
A bright future for datadog-pgo
datadog-pgo is a simple CLI tool that lets you take advantage of PGO by adding a single line of code to your CI scripts. It encodes our best practices for profile selection, and it keeps you protected from known regressions. In the future, we hope to share more details on our fleet-wide rollout results. Meanwhile, the Go team’s PGO journey is just getting started, and there are many opportunities for optimization to be exploited.


No comments:
Post a Comment