No centralized logging solution is complete without an analysis and visualization tool. Without being able to efficiently query and monitor data, there is little use to only aggregating and storing it. Kibana plays that role in the ELK Stack — a powerful analysis and visualization layer on top of Elasticsearch and Logstash.
Shortly after Elastic closed-sourced Kibana in early 2021, AWS spearheaded the community to create OpenSearch Dashboards – a forked Kibana under the Apache 2.0 open source license with a rich ecosystem of plugins. I recommend OpenSearch Dashboards as an open source alternative to Kibana.
If your troubleshooting is limited with the open source capabilities, Logz.io provides enhancements to OpenSearch Dashboards to further accelerate log search with alerts, high performance queries, and ML that automatically highlighting critical errors and exceptions.
What is Kibana?
Kibana is a browser-based user interface that can be used to search, analyze and visualize the data stored in Elasticsearch indices (Kibana cannot be used in conjunction with other databases). Kibana is especially renowned and popular due to its rich graphical and visualization capabilities that allow users to explore large volumes of data.
Kibana can be installed on Linux, Windows and Mac using .zip or tar.gz, repositories or on Docker. Kibana runs on node.js, and the installation packages come built-in with the required binaries.
Please note that changes have been made in more recent versions to the licensing model, including the inclusion of basic X-Pack features into the default installation packages.
Kibana searches
Searching Elasticsearch for specific log messages or strings within these messages is the bread and butter of Kibana. In recent versions of Kibana, improvements and changes to the way searching is done have been applied.
By default, users now use a new querying language called KQL (Kibana Querying Language) to search their data. Users accustomed to the previous method — using Lucene — can opt to do so as well.
Kibana querying is an art unto itself, and there are various methods you can use to perform searches on your data. Here are some of the most common search types:
- Free text searches – used for quickly searching for a specific string.
- Field-level searches – used for searching for a string within a specific field.
- Logical statements – used to combine searches into a logical statement.
- Proximity searches – used for searching terms within a specific character proximity.
Kibana searches cheat sheet
Below is a list of some tips and best practices for using the above-mentioned search types:
- Use free-text searches for quickly searching for a specific string. Use double quotes (“string”) to look for an exact match.
Example: “USA“ - Use the * wildcard symbol to replace any number of characters and the ? wildcard symbol to replace only one character.
- Use the _exists_ prefix for a field to search for logs that have that field.
Example: _exists_:response - You can search a range within a field.
Examples: If you use brackets [], this means that the results are inclusive. If you use {}, this means that the results are exclusive. - When using logical statements (e.g. AND, OR, TO) within a search, use capital letters. Example: response:[400 TO 500]
- Use -,! and NOT to define negative terms.
Example: response:[400 TO 500] AND NOT response:404 - Proximity searches are useful for searching terms within a specific character proximity. Example: [categovi~2] will a search for all the terms that are within two changes from [categovi]. Proximity searches use a lot of resources – use wisely!
- Field level search for non analyzed fields work differently than free text search.
Example: If the field value is Error – searching for field:*rror will not return the right answer. - If you don’t specify a logical operator, the default one is OR.
Example: searching for Error Exception will run a search for Error OR Exception - Using leading wildcards is a very expensive query and should be avoided when possible.
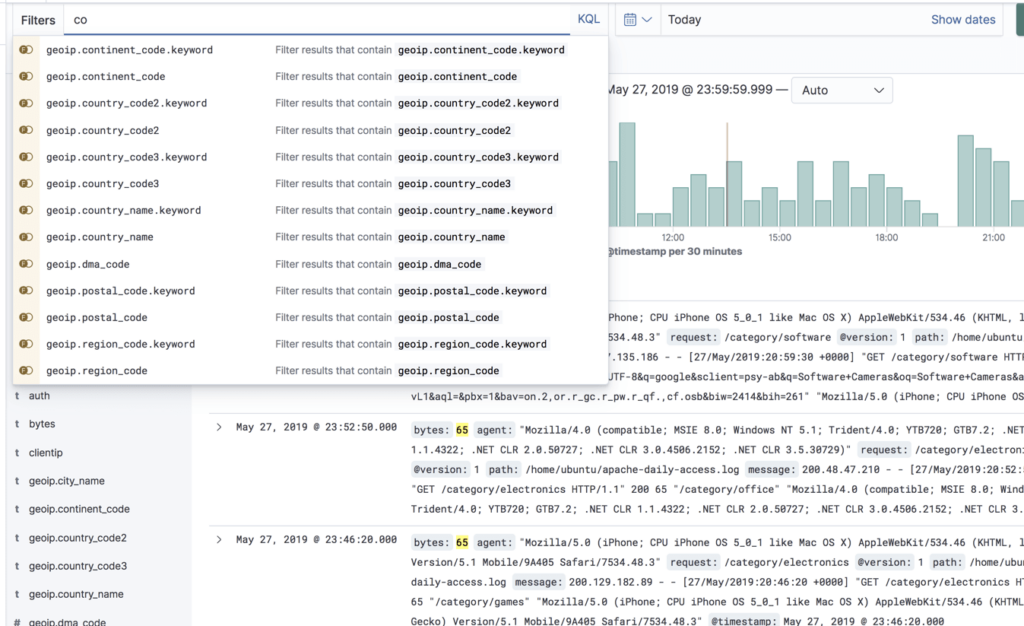
In Kibana 6.3, a new feature simplifies the search experience and includes auto-complete capabilities. This feature needs to be enabled for use, and is currently experimental.
Kibana autocomplete
To help improve the search experience in Kibana, the autocomplete feature suggests search syntax as you enter your query. As you type, relevant fields are displayed and you can complete the query with just a few clicks. This speeds up the whole process and makes Kibana querying a whole lot simpler.

Kibana filtering
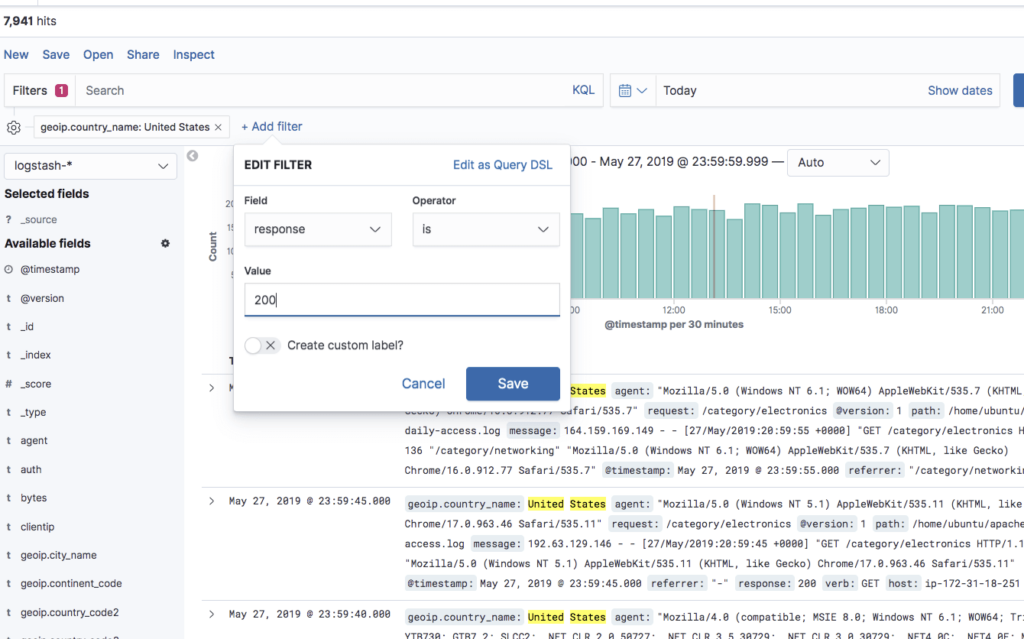
To assist users in searches, Kibana includes a filtering dialog that allows easier filtering of the data displayed in the main view.
To use the dialog, simply click the Add a filter + button under the search box and begin experimenting with the conditionals. Filters can be pinned to the Discover page, named using custom labels, enabled/disabled and inverted.

Kibana visualizations
As mentioned above, Kibana is renowned for visualization capabilities. Using a wide variety of different charts and graphs, you can slice and dice your data any way you want. You can create your own custom visualizations with the help of vega and vega-lite. You will find that you can do almost whatever you want with you data.
Creating visualizations, however, is not always straightforward and can take time. Key to making this process painless is knowing your data. The more you are acquainted with the different nooks and crannies in your data, the easier it is.
Kibana visualizations are built on top of Elasticsearch queries. Using Elasticsearch aggregations (e.g. sum, average, min, mac, etc.), you can perform various processing actions to make your visualizations depict trends in the data.

Visualization types
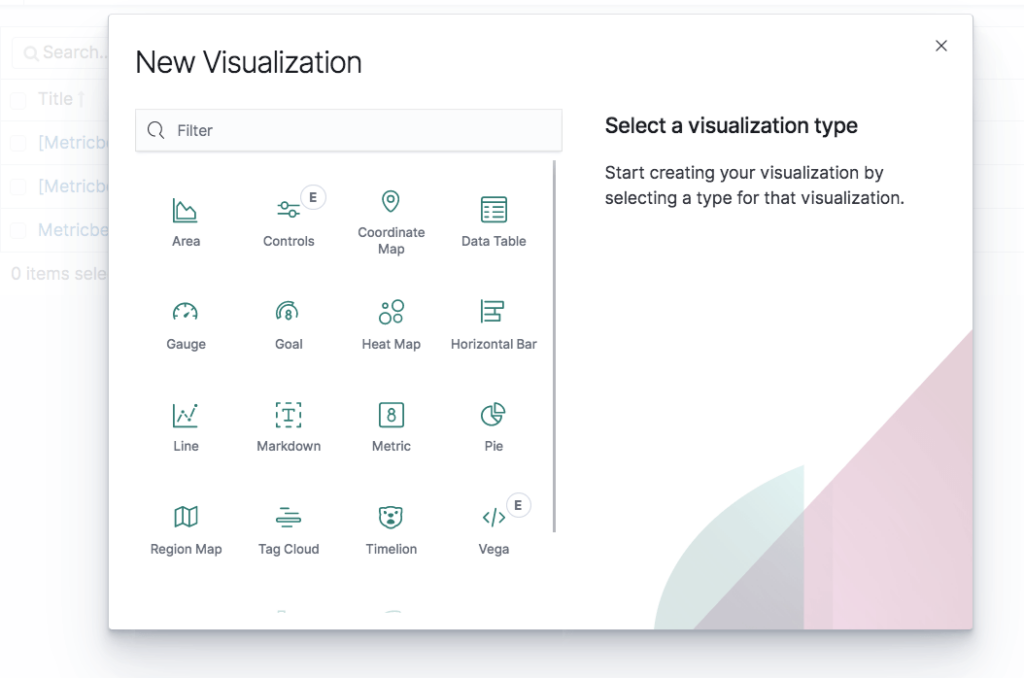
Visualizations in Kibana are categorized into five different types of visualizations:
- Basic Charts (Area, Heat Map, Horizontal Bar, Line, Pie, Vertical bar)
- Data (Date Table, Gauge, Goal, Metric)
- Maps (Coordinate Map, Region Map)
- Time series (Timelion, Visual Builder)
- Other (Controls, Markdown, Tag Cloud)
In the table below, we describe the main function of each visualization and a usage example:
| Vertical Bar Chart: Great For Time Series Data And For Splitting Lines Across Fields | URLs over time |
| Pie Chart: Useful For Displaying Parts Of A Whole | Top 5 memory consuming system procs |
| Area Chart: For Visualizing Time Series Data And For Splitting Lines On Fields | Users over time |
| Heat Map: For Showing Statistical Outliers And Are Often Used For Latency Values | Latency and outliers |
| Horizontal Bar Chart: Good For Showing Relationships Between Two Fields | URL and referrer |
| Line Chart: Are A Simple Way To Show Time Series And Are Good For Splitting Lines To Show Anomalies | Average CPU over time by host |
| Data Table: Best Way To Split Across Multiple Fields In A Custom Way | Top user, host, pod, container by usage |
| Gauge: A Way To Show The Status Of A Specific Metric Using Thresholds You Define | Memory consumption limits |
| Metric: Useful Visualization For Displaying A Calculation As A Single Number | No. of Docker containers run. |
| Coordinate Map & Region Map: Help Add A Geographical Dimension To IP-Based Logs | Geographic origin of web server requests. |
| Timelion And Visual Query Builder: Allows You To Create More Advanced Queries Based On Time Series Data | Percentage of 500 errors over time |
| Markdown: A Great Way To Add A Customized Text Or Image-Based Visualization To Your Dashboard Based On Markdown Syntax | Company logo or a description of a dashboard |
| Tag Cloud: Helps Display Groups Of Words Sized By Their Importance | Countries sending requests to a web server |
Kibana dashboards
Once you have a collection of visualizations ready, you can add them all into one comprehensive visualization called a dashboard. Dashboards give you the ability to monitor a system or environment from a high vantage point for easier event correlation and trend analysis.
Dashboards are highly dynamic — they can be edited, shared, played around with, opened in different display modes, and more. Clicking on one field in a specific visualization within a dashboard, filters the entire dashboard accordingly (you will notice a filter added at the top of the page).
Kibana pages
Recent versions of Kibana include dedicated pages for various monitoring features such as APM and infrastructure monitoring. Some of these features were formerly part of the X-Pack, others, such as Canvas and Maps, are brand new:
- Canvas – the “photoshop” of machine-generated data, Canvas is an advanced visualization tool that allows you to design and visualize your logs and metrics in creative new ways.
- Maps – meant for geospatial analysis, this page supports multiple layers and data sources, the mapping of individual geo points and shapes, global searching for ad-hoc analysis, customization of elements, and more.
- Infrastructure – helps you gain visibility into the different components constructing your infrastructure, such as hosts and containers.
- Logs – meant for live tracking of incoming logs being shipped into the stack with Logstash.
- APM – designed to help you monitor the performance of your applications and identify bottlenecks.
- Uptime – allows you to monitor and gauge the status of your applications using a dedicated UI, based on data shipped into the stack with Heartbeat.
- Stack Monitoring – provides you with built-in dashboards for monitoring Elasticsearch, Kibana, Logstash and Beats. Requires manual configuration.
Note: These pages are not licensed under Apache 2.0 but under Elastic’s Basic license.
Kibana Elasticsearch index
The searches, visualizations, and dashboards saved in Kibana are called objects. These objects are stored in a dedicated Elasticsearch index (.kibana) for debugging, sharing, repeated usage and backup.
The index is created as soon as Kibana starts. You can change its name in the Kibana configuration file. The index contains the following documents, each containing their own set of fields:
- Saved index patterns
- Saved searches
- Saved visualizations
- Saved dashboards
What’s next?
This article covered the functions you will most likely be using Kibana for, but there are plenty more tools to learn about and play around with. There are development tools such as Console, and if you’re using X-Pack, additional monitoring and alerting features.
It’s important to note that for production, you will most likely need to add some elements to Kibana to make it more secure and robust. For example, placing a proxy such as Nginx in front of Kibana or plugging in an alerting layer. This requires additional configuration or costs.


No comments:
Post a Comment