The ELK Stack can be installed using a variety of methods and on a wide array of different operating systems and environments. ELK can be installed locally, on the cloud, using Docker and configuration management systems like Ansible, Puppet, and Chef. The stack can be installed using a tarball or .zip packages or from repositories.
Many of the installation steps are similar from environment to environment and since we cannot cover all the different scenarios, we will provide an example for installing all the components of the stack — Elasticsearch, Logstash, Kibana, and Beats — on Linux. Links to other installation guides can be found below.
For those who want to skip ELK installation, they can try Logz.io Log Management, which provides a scalable, reliable, out-of-the-box logging pipeline without requiring any installation or configuration – all based on OpenSearch and OpenSearch Dashboards.
Environment specifications
To perform the steps below, we set up a single AWS Ubuntu 18.04 machine on an m4.large instance using its local storage. We started an EC2 instance in the public subnet of a VPC, and then we set up the security group (firewall) to enable access from anywhere using SSH and TCP 5601 (Kibana). Finally, we added a new elastic IP address and associated it with our running instance in order to connect to the internet.
Please note that the version we installed here is 6.2. Changes have been made in more recent versions to the licensing model, including the inclusion of basic X-Pack features into the default installation packages.
Installing Elasticsearch
First, you need to add Elastic’s signing key so that the downloaded package can be verified (skip this step if you’ve already installed packages from Elastic):
wget -qO - https://artifacts.elastic.co/GPG-KEY-elasticsearch | sudo apt-key add -For Debian, we need to then install the apt-transport-https package:
sudo apt-get update sudo apt-get install apt-transport-httpsThe next step is to add the repository definition to your system:
echo "deb https://artifacts.elastic.co/packages/7.x/apt stable main" | sudo tee -a /etc/apt/sources.list.d/elastic-7.x.listTo install a version of Elasticsearch that contains only features licensed under Apache 2.0 (aka OSS Elasticsearch):
echo "deb https://artifacts.elastic.co/packages/oss-7.x/apt stable main" | sudo tee -a /etc/apt/sources.list.d/elastic-7.x.listAll that’s left to do is to update your repositories and install Elasticsearch:
sudo apt-get update sudo apt-get install elasticsearchElasticsearch configurations are done using a configuration file that allows you to configure general settings (e.g. node name), as well as network settings (e.g. host and port), where data is stored, memory, log files, and more.
For our example, since we are installing Elasticsearch on AWS, it is a good best practice to bind Elasticsearch to either a private IP or localhost:
sudo vim /etc/elasticsearch/elasticsearch.yml network.host: "localhost" http.port:9200 cluster.initial_master_nodes: ["<PrivateIP"]To run Elasticsearch, use:
sudo service elasticsearch startTo confirm that everything is working as expected, point curl or your browser to http://localhost:9200, and you should see something like the following output:
{ "name" : "ip-172-31-10-207", "cluster_name" : "elasticsearch", "cluster_uuid" : "bzFHfhcoTAKCH-Niq6_GEA", "version" : { "number" : "7.1.1", "build_flavor" : "default", "build_type" : "deb", "build_hash" : "7a013de", "build_date" : "2019-05-23T14:04:00.380842Z", "build_snapshot" : false, "lucene_version" : "8.0.0", "minimum_wire_compatibility_version" : "6.8.0", "minimum_index_compatibility_version" : "6.0.0-beta1" }, "tagline" : "You Know, for Search" }Installing an Elasticsearch cluster requires a different type of setup. Read our Elasticsearch Cluster tutorial for more information on that.
Installing Logstash
Logstash requires Java 8 or Java 11 to run so we will start the process of setting up Logstash with:
sudo apt-get install default-jreVerify java is installed:
java -version openjdk version "1.8.0_191" OpenJDK Runtime Environment (build 1.8.0_191-8u191-b12-2ubuntu0.16.04.1-b12) OpenJDK 64-Bit Server VM (build 25.191-b12, mixed mode)Since we already defined the repository in the system, all we have to do to install Logstash is run:
sudo apt-get install logstashBefore you run Logstash, you will need to configure a data pipeline. We will get back to that once we’ve installed and started Kibana.
Installing Kibana
As before, we will use a simple apt command to install Kibana:
sudo apt-get install kibanaOpen up the Kibana configuration file at: /etc/kibana/kibana.yml, and make sure you have the following configurations defined:
server.port: 5601 elasticsearch.url: "http://localhost:9200"These specific configurations tell Kibana which Elasticsearch to connect to and which port to use.
Now, start Kibana with:
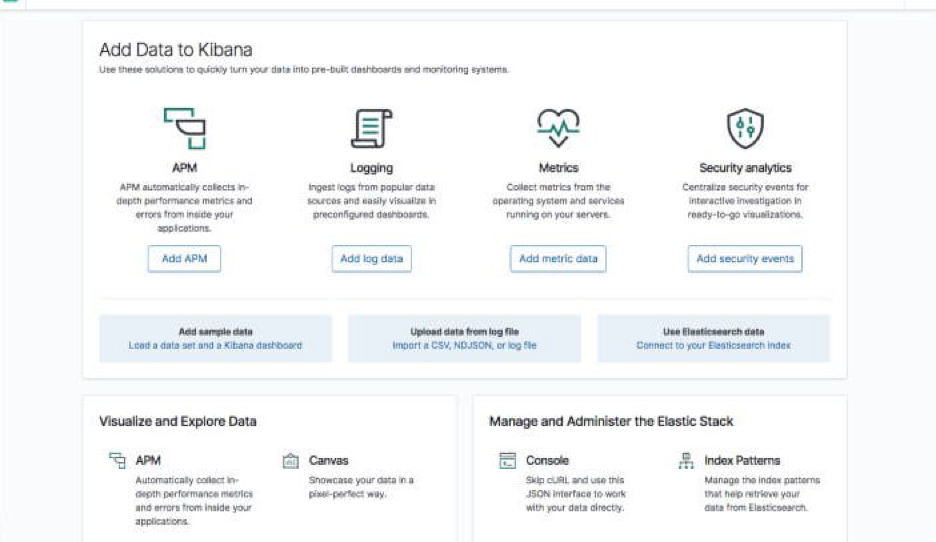
sudo service kibana startOpen up Kibana in your browser with: http://localhost:5601. You will be presented with the Kibana home page.

Installing Beats
The various shippers belonging to the Beats family can be installed in exactly the same way as we installed the other components.
As an example, let’s install Metricbeat:
sudo apt-get install metricbeatTo start Metricbeat, enter:
sudo service metricbeat startMetricbeat will begin monitoring your server and create an Elasticsearch index which you can define in Kibana. In the next step, however, we will describe how to set up a data pipeline using Logstash.
More information on using the different beats is available on our blog:
Shipping some data
For the purpose of this tutorial, we’ve prepared some sample data containing Apache access logs that is refreshed daily.
Next, create a new Logstash configuration file at: /etc/logstash/conf.d/apache-01.conf:
sudo vim /etc/logstash/conf.d/apache-01.confEnter the following Logstash configuration (change the path to the file you downloaded accordingly):
input { file { path => "/home/ubuntu/apache-daily-access.log" start_position => "beginning" sincedb_path => "/dev/null" } } filter { grok { match => { "message" => "%{COMBINEDAPACHELOG}" } } date { match => [ "timestamp" , "dd/MMM/yyyy:HH:mm:ss Z" ] } geoip { source => "clientip" } } output { elasticsearch { hosts => ["localhost:9200"] } }Start Logstash with:
sudo service logstash startIf all goes well, a new Logstash index will be created in Elasticsearch, the pattern of which can now be defined in Kibana.
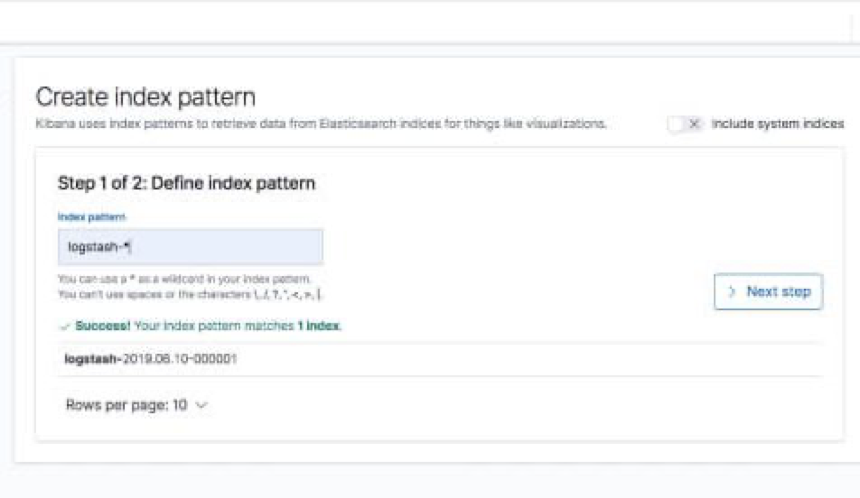
In Kibana, go to Management → Kibana Index Patterns. Kibana should display the Logstash index and along with the Metricbeat index if you followed the steps for installing and running Metricbeat).

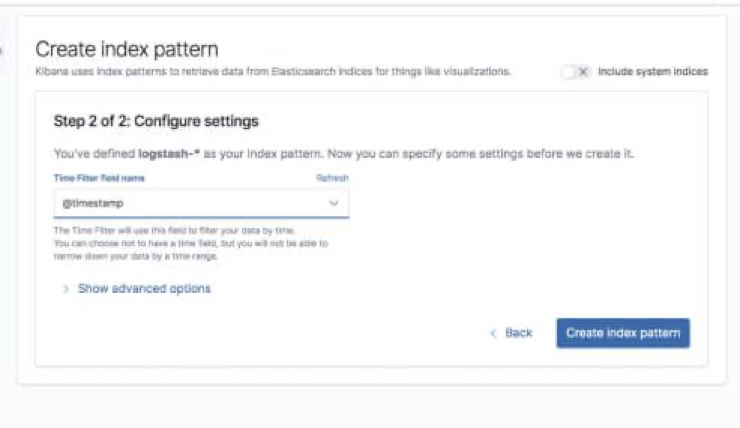
Enter “logstash-*” as the index pattern, and in the next step select @timestamp as your Time Filter field.

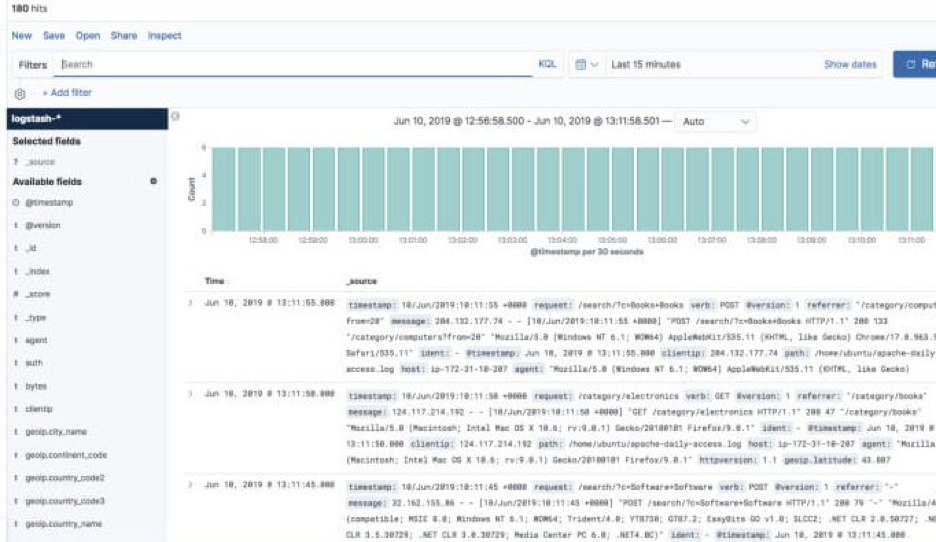
Hit Create index pattern, and you are ready to analyze the data. Go to the Discover tab in Kibana to take a look at the data (look at today’s data instead of the default last 15 mins).

Congratulations! You have set up your first ELK data pipeline using Elasticsearch, Logstash, and Kibana.


No comments:
Post a Comment