What Is Grafana?
Grafana is a database analysis and monitoring tool. It allows you to create dashboard visualizations of key metrics that are important to you. Grafana has a thriving community of enthusiasts who share reusable dashboards.
Grafana supports a huge number of data sources. And, since the application is open source, you can be sure that the moment a new data source has been released, someone out there is adding support for it. The most common use case of Grafana is displaying time series data, such as memory or CPU over time, alongside the current usage data.
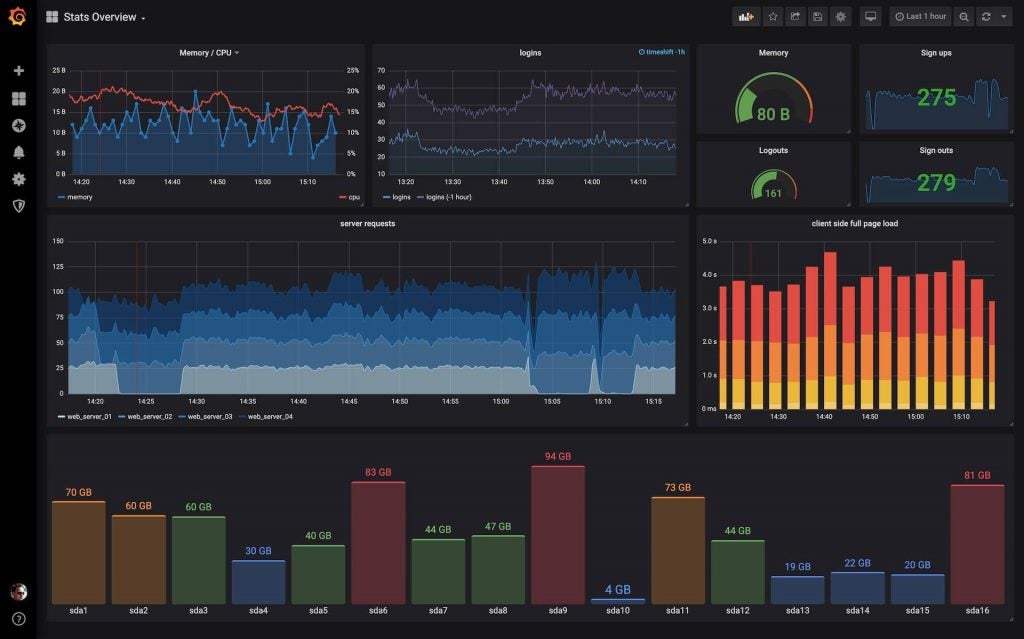
You can host Grafana yourself, use the managed service in AWS or get the creators to host it for you. Grafana runs as a process on your computer or server, and you access the interface through your browser. Your dashboard can display your data as single numbers, graphs, charts, or even a heat map. Below is an example dashboard set up through the Grafana web interface:

Installing Grafana Locally
The instructions for installation depend on where you plan to run Grafana. I normally run applications like this locally to get a feel for how it works before deploying remotely. Grafana provides comprehensive instructions for wherever you want to deploy it.
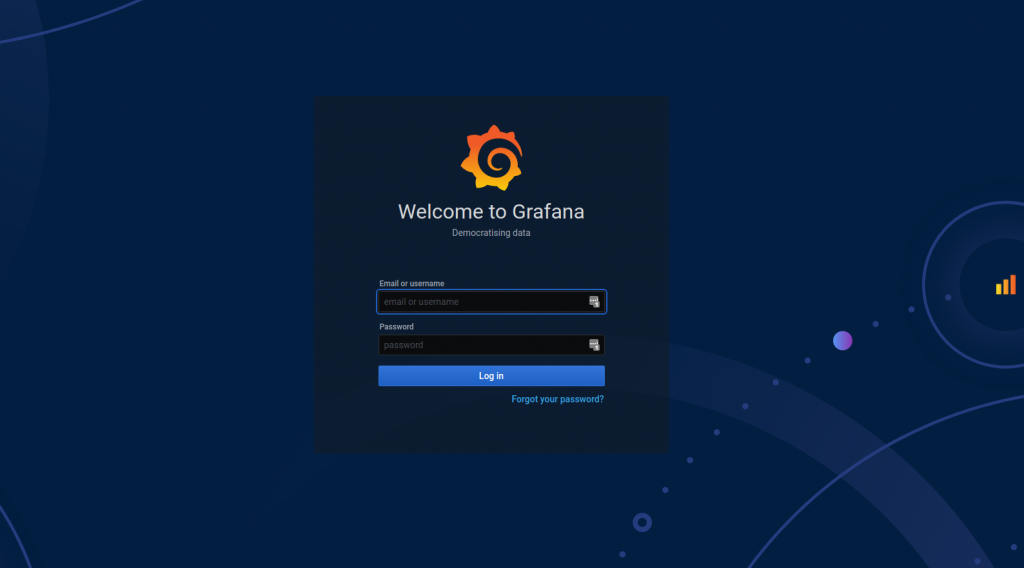
If the installation was a success, then Grafana should be available through your web browser by default on http://localhost:3000, and your screen should look like the image below. The default username is admin and the default password is also admin. You will be asked to change your password after logging in.

Configuring Your DataSource
Configuring your data source is the first step to setting up your Grafana dashboard. Your data source could be a database or a collection of logs. Grafana supports pretty much every data source you can think of, from traditional databases like MySQL to log aggregation platforms like AWS Cloudwatch.
Now we’ll walk through configuring Grafana to connect to your MySQL database. For my example, I’ve created a database named CD with a table called Artist to simulate a database behind a music library app.
Your first step is to add a Grafana user to your database. In your MySQL database, run the following in the database administrator role to add a read-only user named grafanaReader to your database CD for the table Artist:
CREATE USER 'grafanaReader' IDENTIFIED BY 'password';
GRANT SELECT ON CD.Artist TO 'grafanaReader';
To add a link from your database to Grafana, switch back to the Grafana interface.
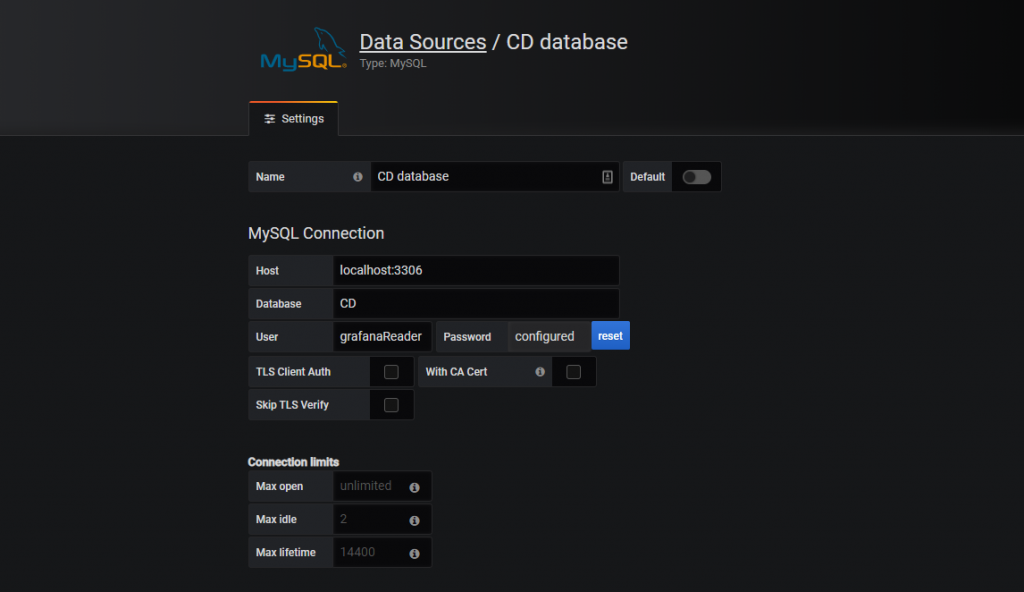
The first option on the display is Create your first datasource. Complete the web form with your connection details. I’m using a local MySQL database running on localhost on port 3306 for the database CD and with the user we made previously, grafanaReader. It’s safe to leave the rest of the fields as default. Hit save and test. If everything is configured correctly, you should see a green box with the message Database Connection OK.


No comments:
Post a Comment